Power (Monitoring) to the People
Off Grid CTO: Monitoring Power Usage
In this week’s blog post, about living life off the grid while working as the CTO of ModelOp, a great startup developing software for managing AI resources in your enterprise, we are going to look at an actual hardware and software project I undertook.
When living and working off grid, knowing exactly how much power you are using vs producing is critical in your day to day activities. The last thing you can do is to run out of power in the middle of a meeting and have your whole house shutdown. A lot of this comes down to knowledge about how much is really going into your batteries at any point in time, and how much is going out, so you can understand and make choices about whether or not you choose to stay up late watching that extra episode or movie.
To this point I have always had the ability to monitor how much the panels are generating, and how much I am using via some simple meters. In this week’s blog we are going to look out how we take that to the next level and create a single pane of glass into all of our energy usage, and really how much is going into or out of the batteries at any instant in time, no matter if it comes from the generator or the sun. To do this, we are going to need to build some hardware, and write some software.

Simple Monitoring
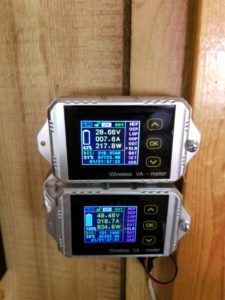
The existing solution that I have used for several years is a manual process that involves two wireless monitors. They work by installing a shunt inline with the wire being measured. So I have one installed on the cable from the solar charge controller to the batteries, and another one installed on the cable from the batteries to the wiring in the cabin (the load).
This does let me visually look and see what I am producing vs what I am consuming at any time, and also to monitor the battery voltage to see if I am approaching a critical level or not, and get a sense of the state of charge of the system. This is handy in the house, but gives me no remote capability to monitor this at all, nor to track over time.
The Charge Controller
The charge controller does give us a variety of statistics about what it is doing, via the modbus protocol, but unfortunately it can not tell us about load in the system, or more critically, exactly how much energy is making it into the batteries vs used up live by current energy demands.
That said, this is very valuable data that is an important part of the solution. So we really want to capture it. Currently, I import this data, along with my weather station data, into weewx, a weather station monitoring program that also runs on a raspberry pi. We will be looking at that process in more detail in another post. This is great for historical data capture, but is not so great for live monitoring as it only updates every five minutes. On a partly cloudy day, it does not give us a very good picture of what is going on. I needed a solution that would replace the above meters with all of the data needed in one place for a quick glance picture of what is going on in my system.
Measuring the Load
So it came down to that I needed to be able to pull together information from the charge controller, as it can tell me battery voltage, solar panel watts being generated, etc., but needed to add information about actual system load. Further, unlike the current shunt based system, I needed it to measure bidirectionally, so I could really see exactly how many amps were going into, or out of, my batteries.
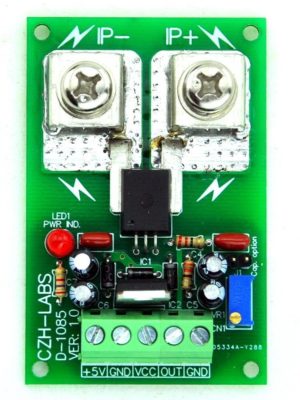
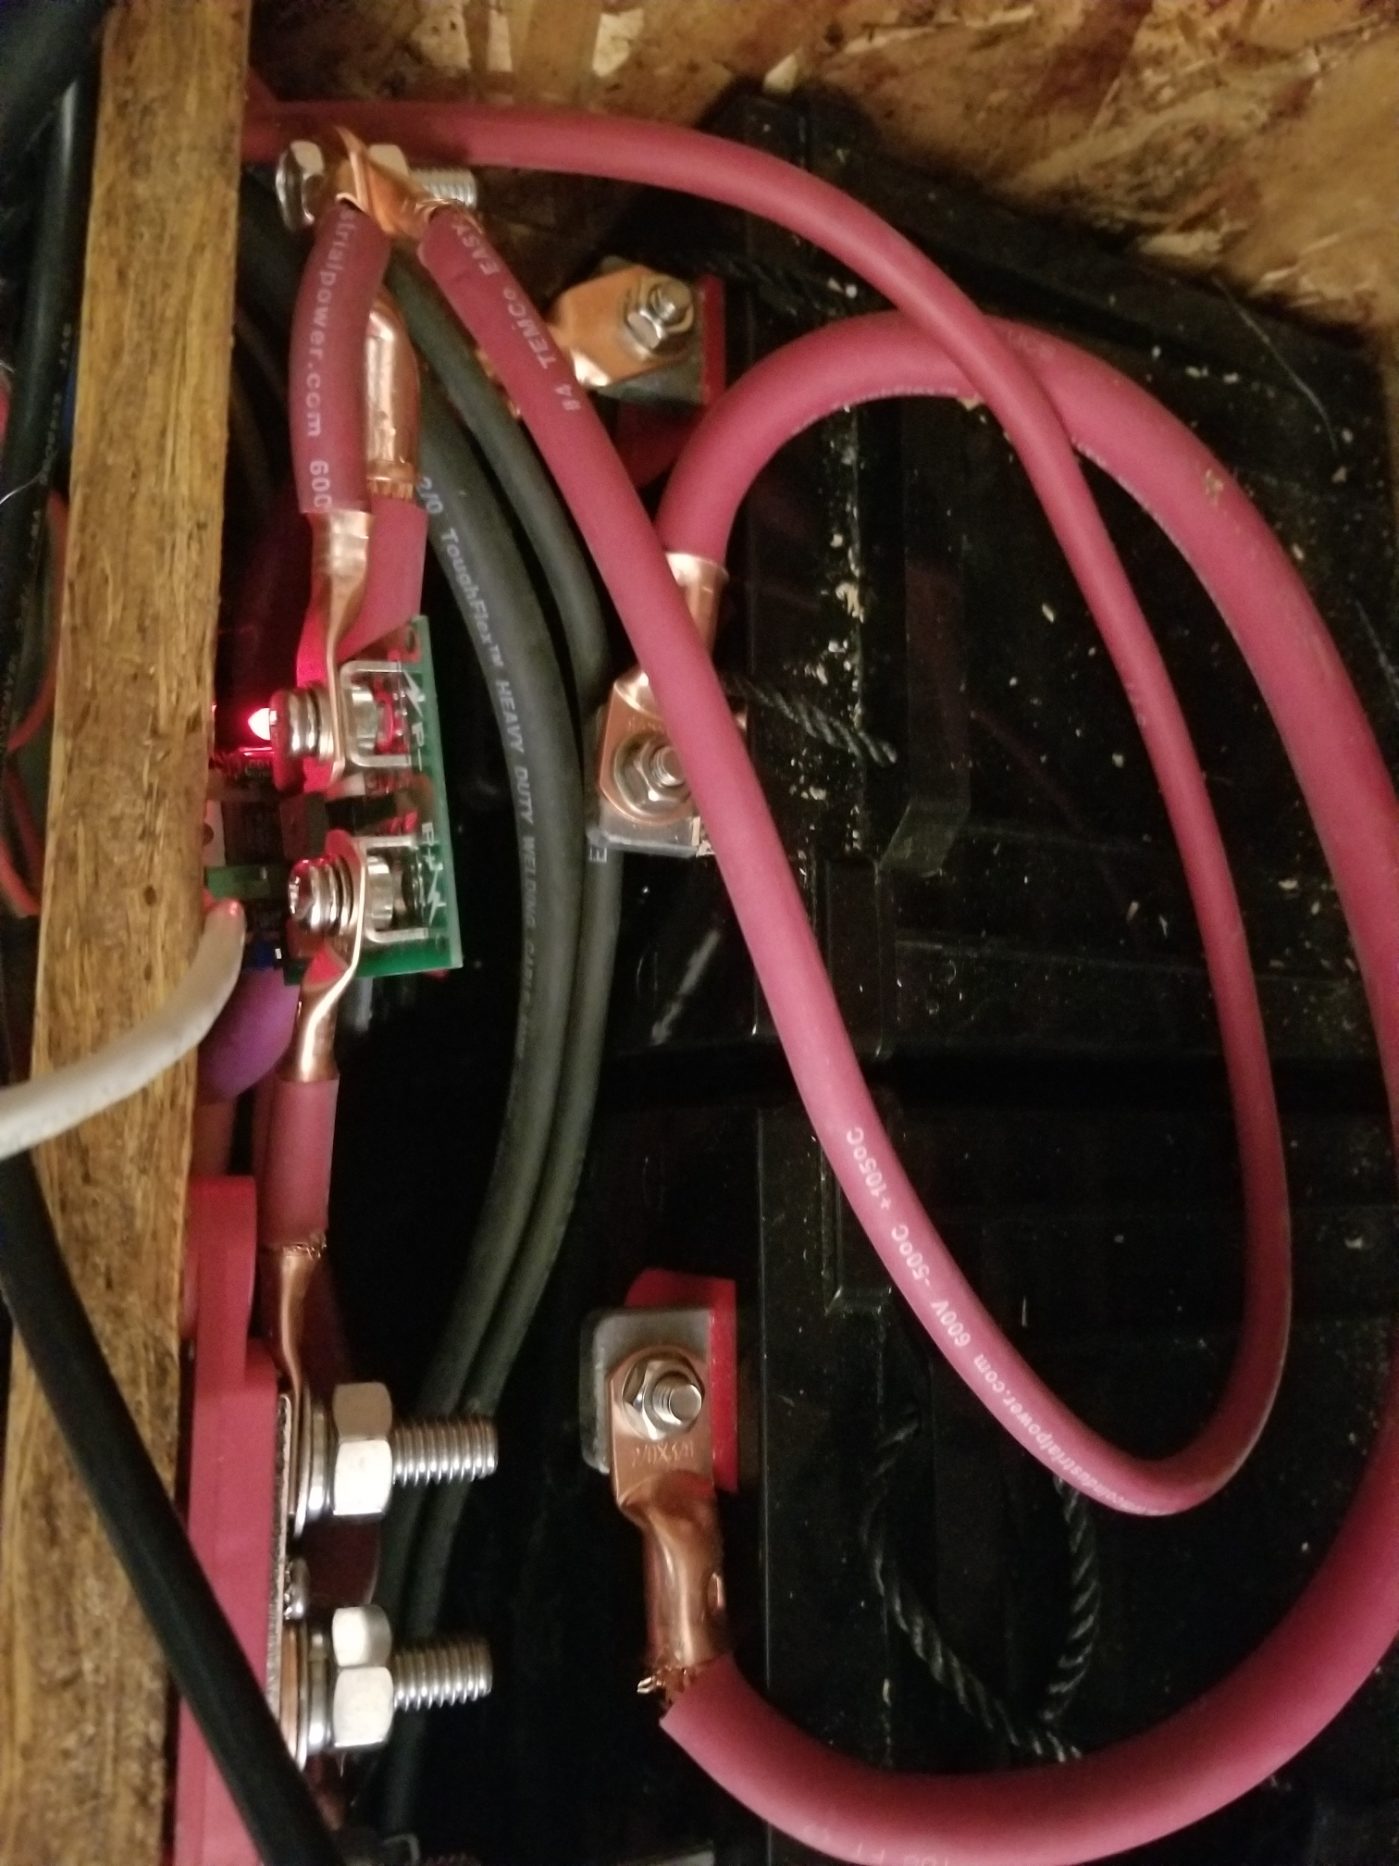
I found the holy grail in the ACS758 hall effect based linear current sensor IC. It outputs amperage from -100 amps to +100 amps and would allow me to really see what was coming into and out of my batteries. In order to put it to use, though, I had to add a system to read those values, and wanted to do it in an expandable way.
Getting the Current Data
As we talk about all of these components, I want to point out that all of the code for this project is available on my project github page in various subdirectories. Eventually this will be expanded to include weewx integration, but for now you will find the necessary Arduino sketch and Dash application we are viewing in this blog post. So ignore the references to weewx, and I will be doing another blog post on that process in the future as I complete that work for storing the data over long period of time.
To monitor the actual current, I placed the current sensor inline with the batteries and both the charge cables from the solar charge controller, as well as the load cables. In this way any energy coming into, or out of, the batteries will be captured. If we receive a negative value, we are putting energy into the batteries, and on a positive value, it indicates we are drawing out of the batteries.
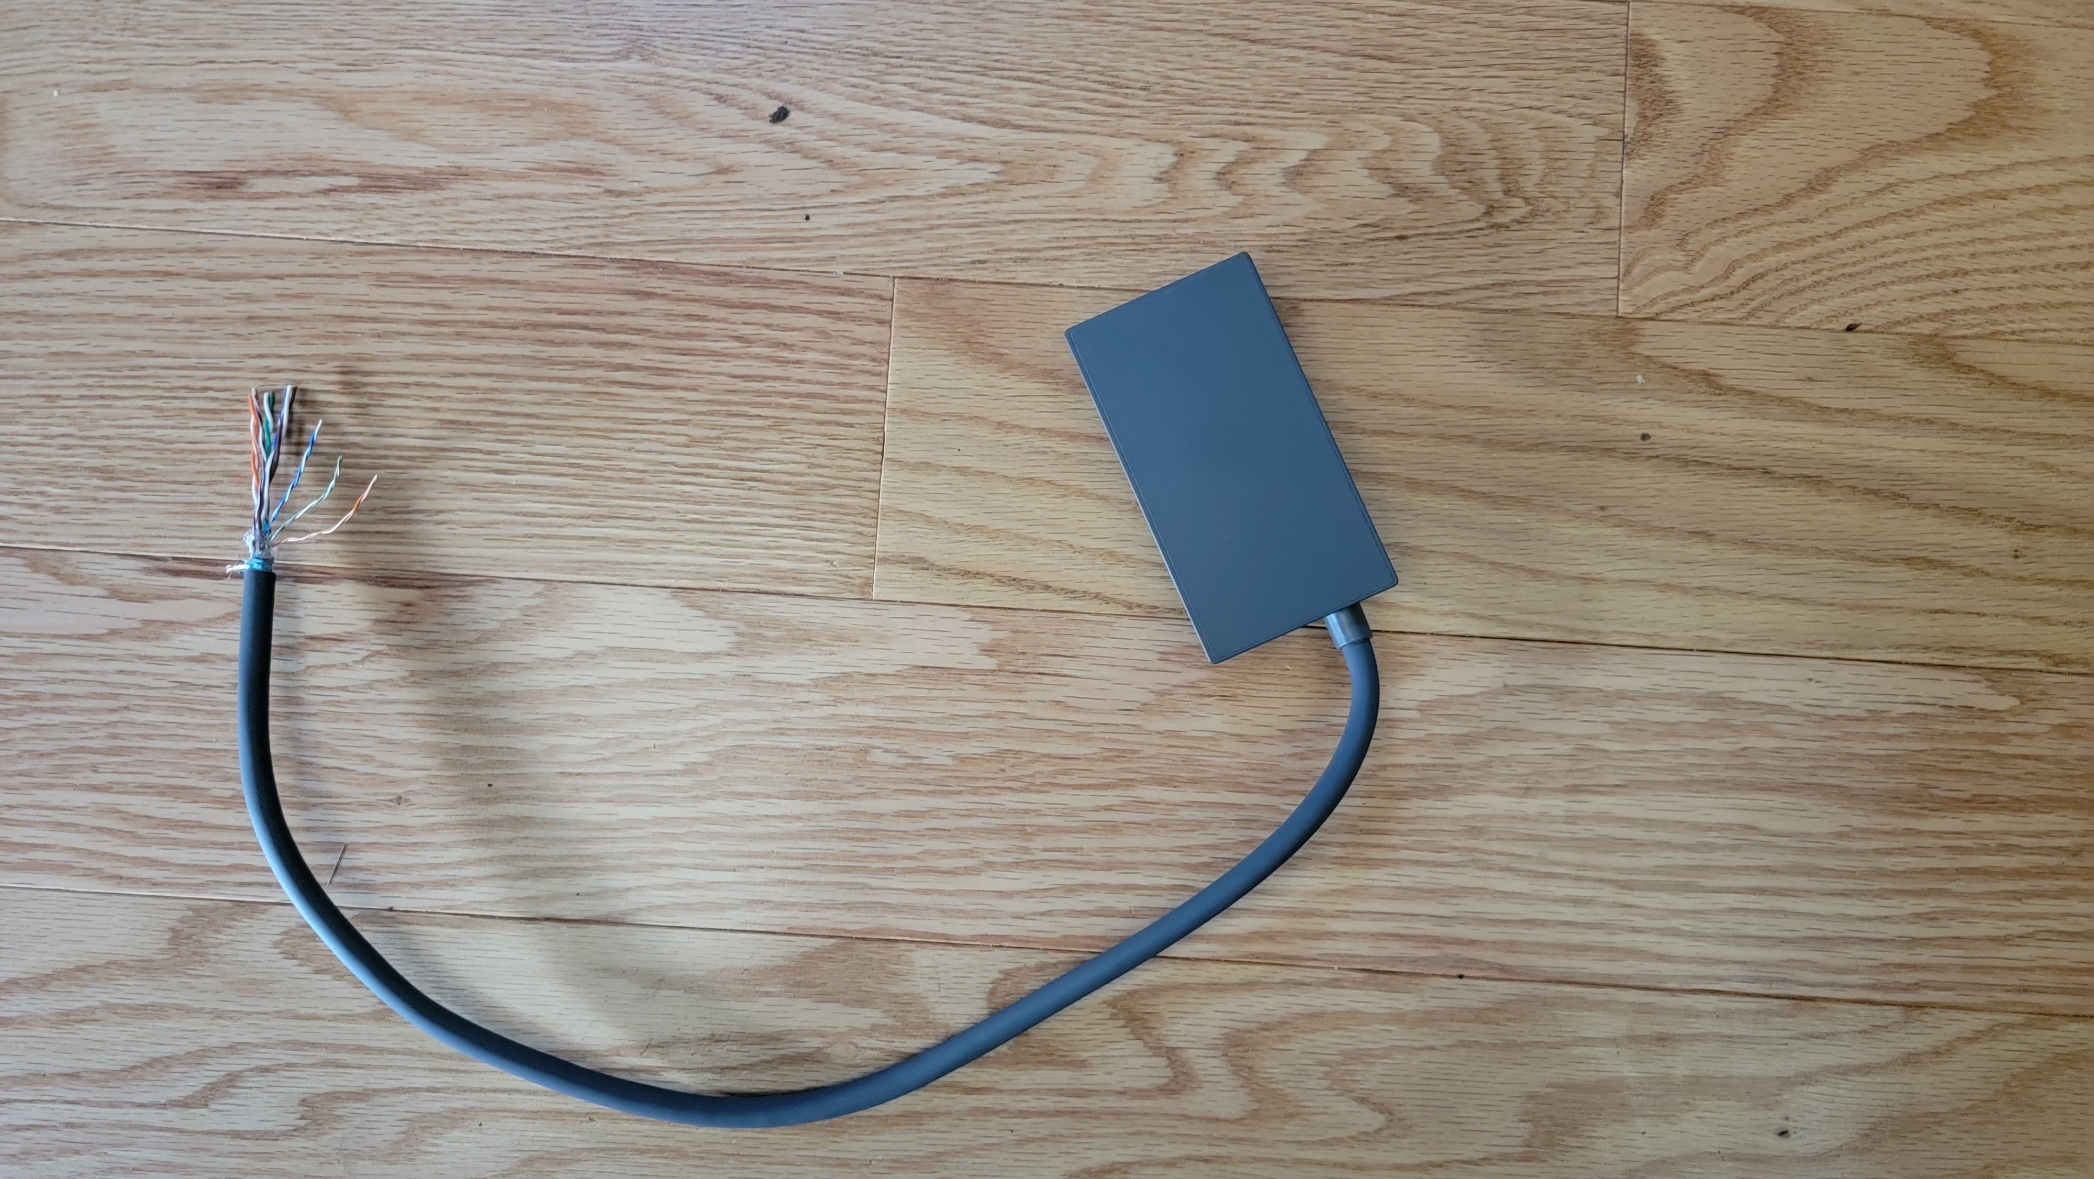
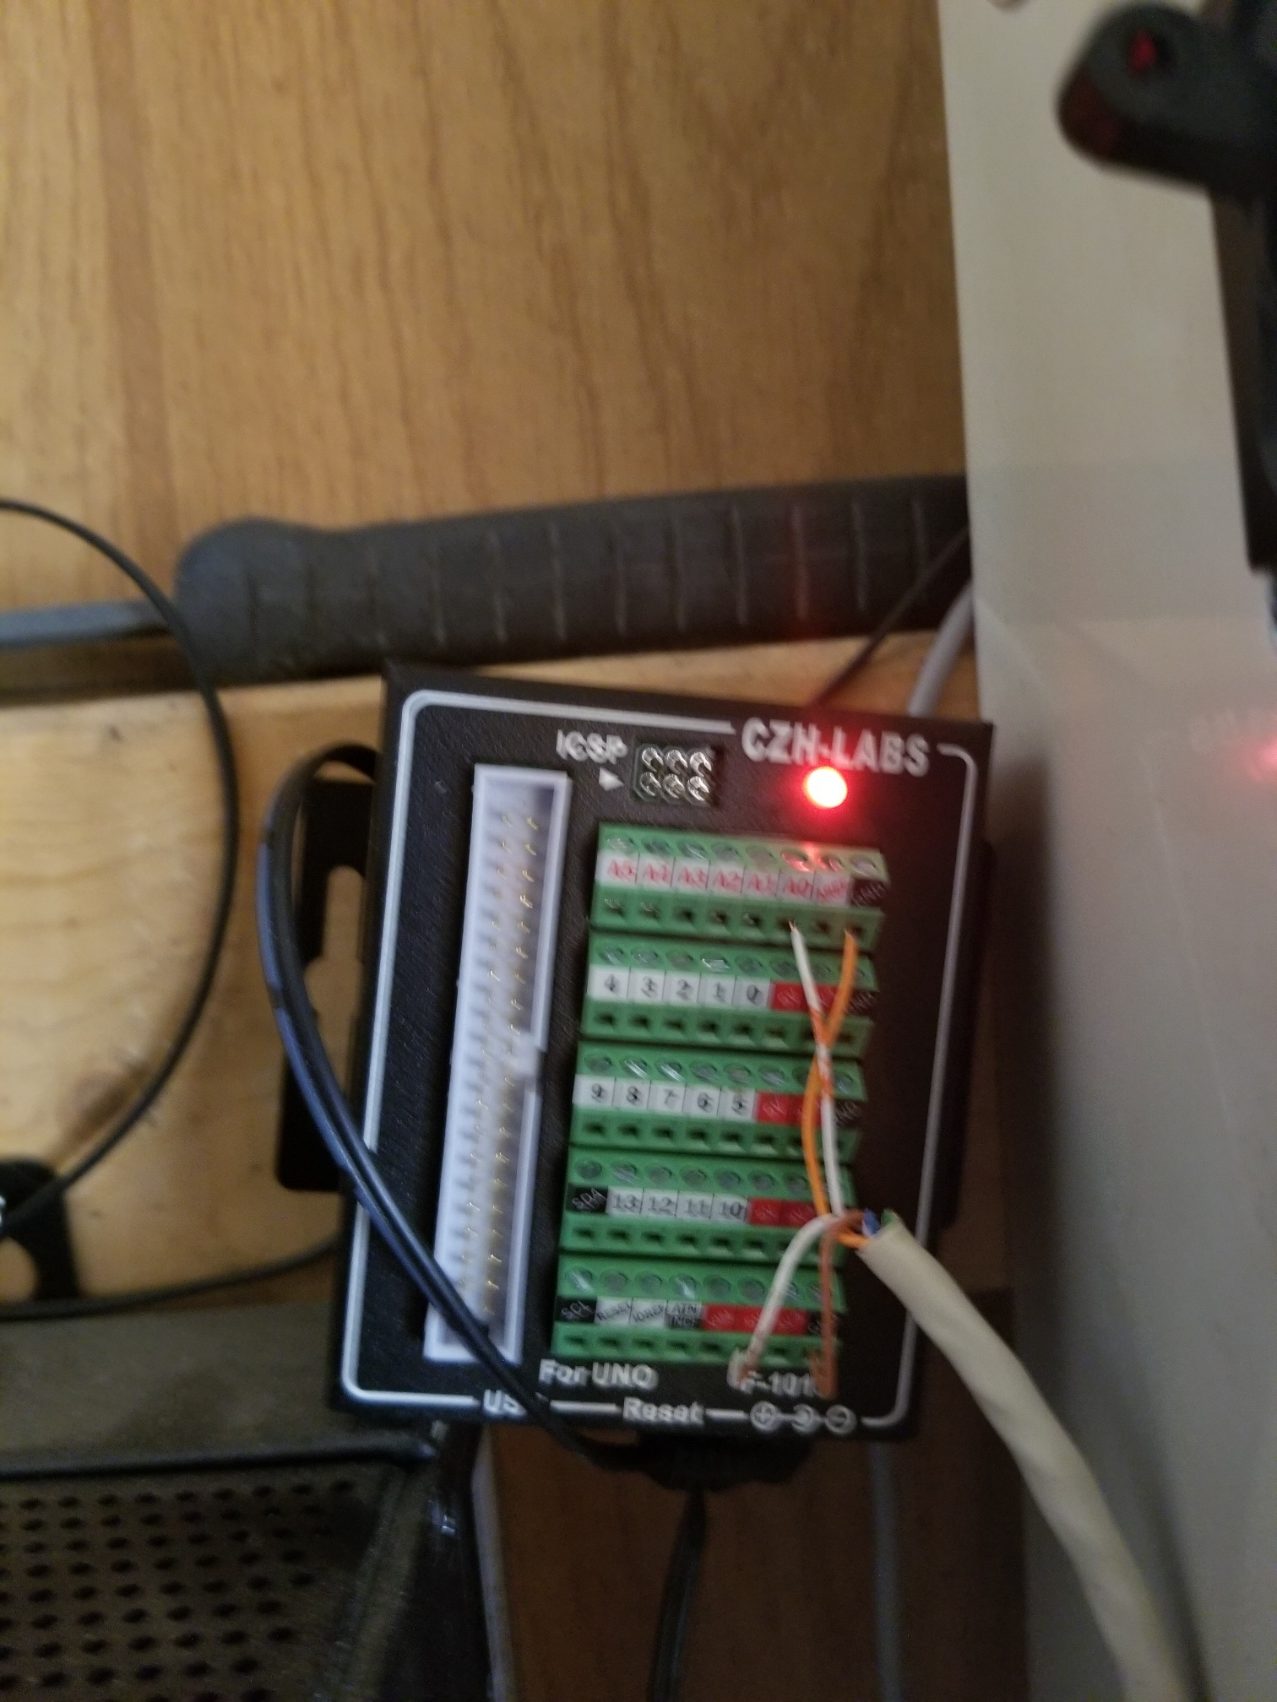
To monitor these values, I utilized an Arduino Uno Wifi board in an industrial enclosure. You can find the code up on my github project page, but in essence it sets up a mini rest server that allows you to query any analog port for the current amperage value.
The current sensor is wired to the +5v and Gnd ports on both the sensor and the Arduino. Also, I have wired from the A0 port and the Gnd port on the Arduino, to the the Out and Gnd port on the sensor.
The software linked to above will spin up, open up a REST endpoint (<ipaddr>/A0) which can then be queried. This will allow me to add other sensors to the other A<x> ports for other purposes as I go along. I could now query for the current amperage with any REST capable client.
A Single View
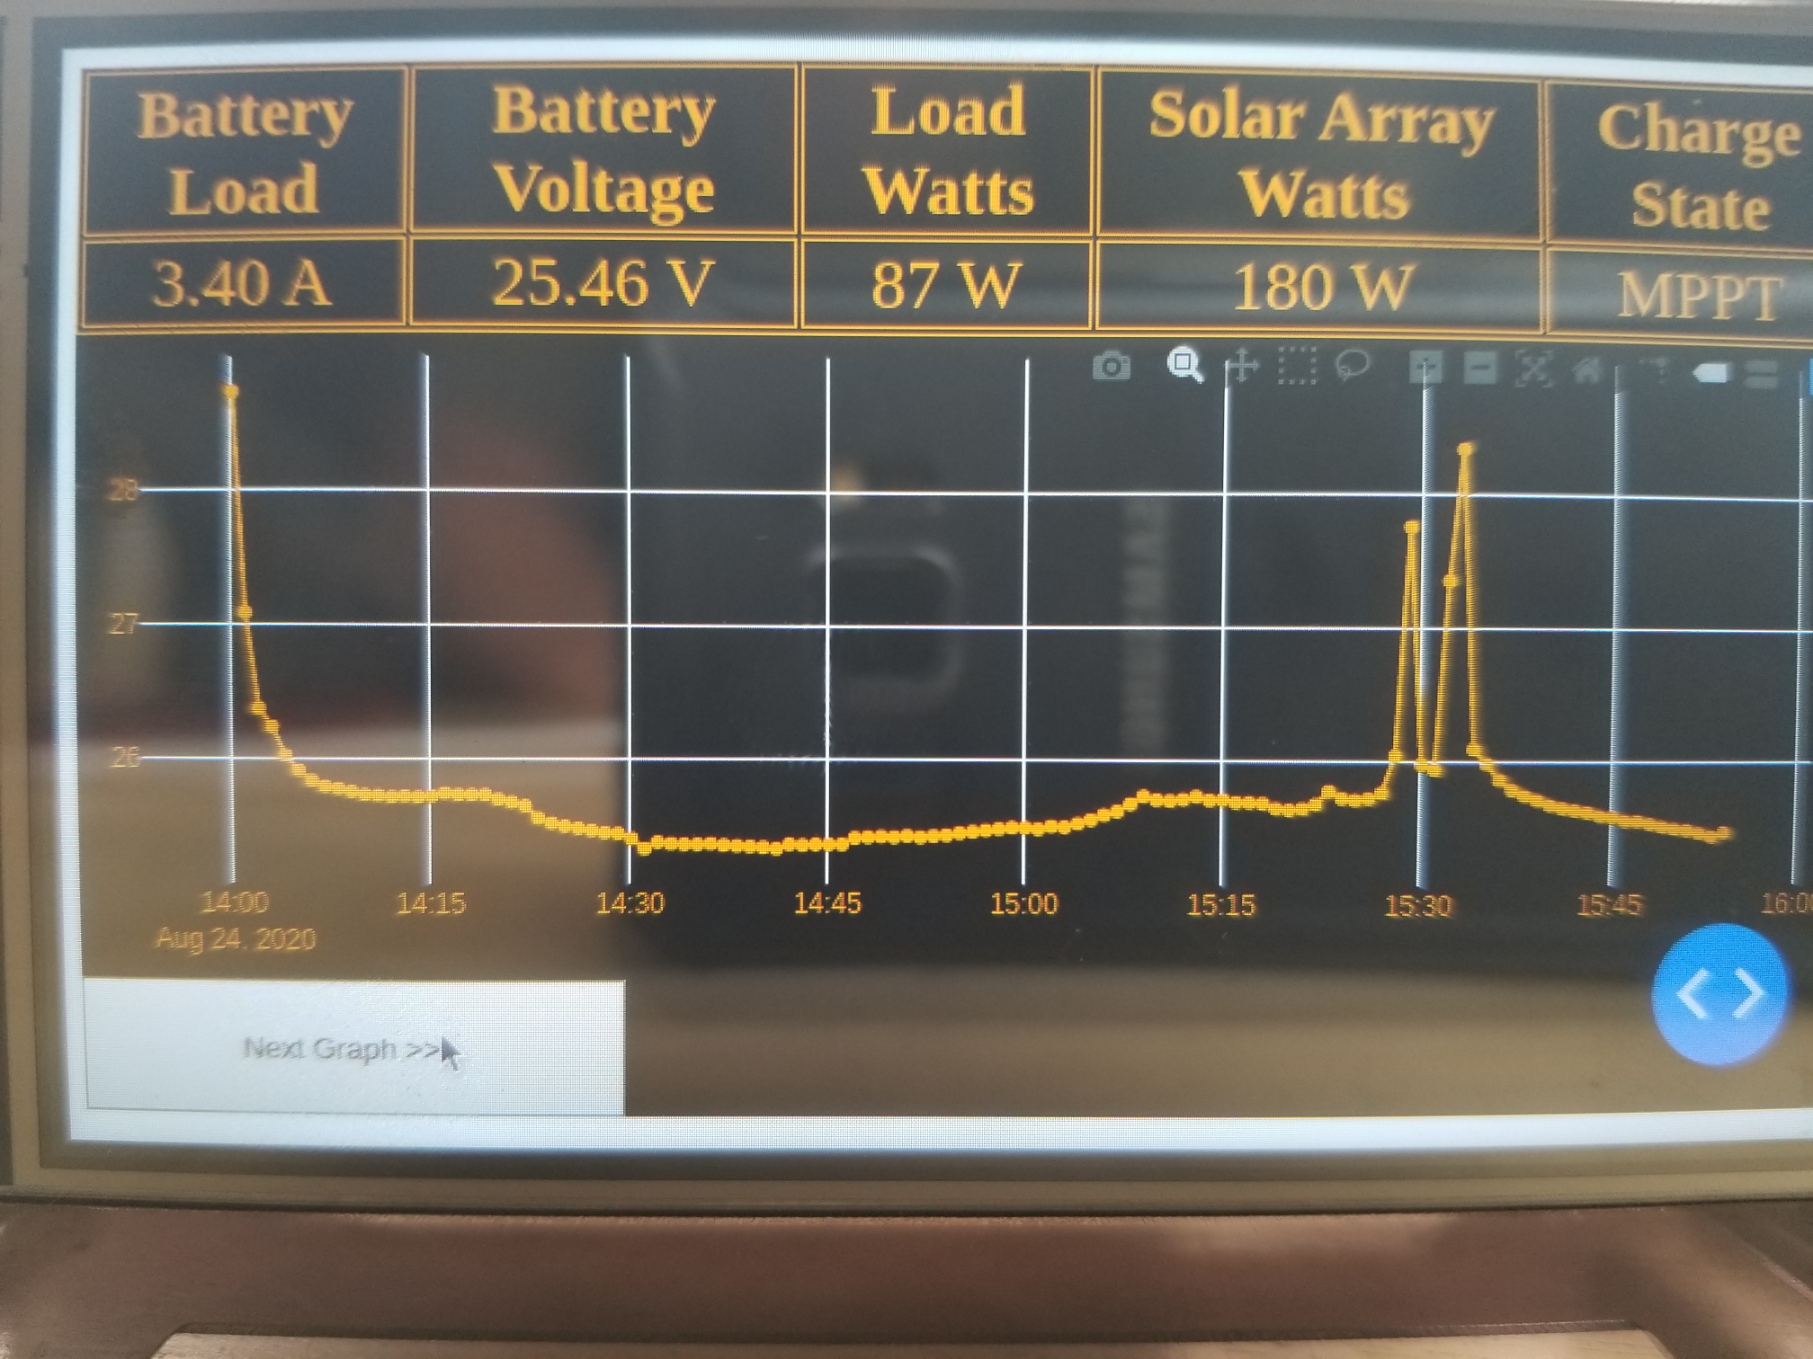
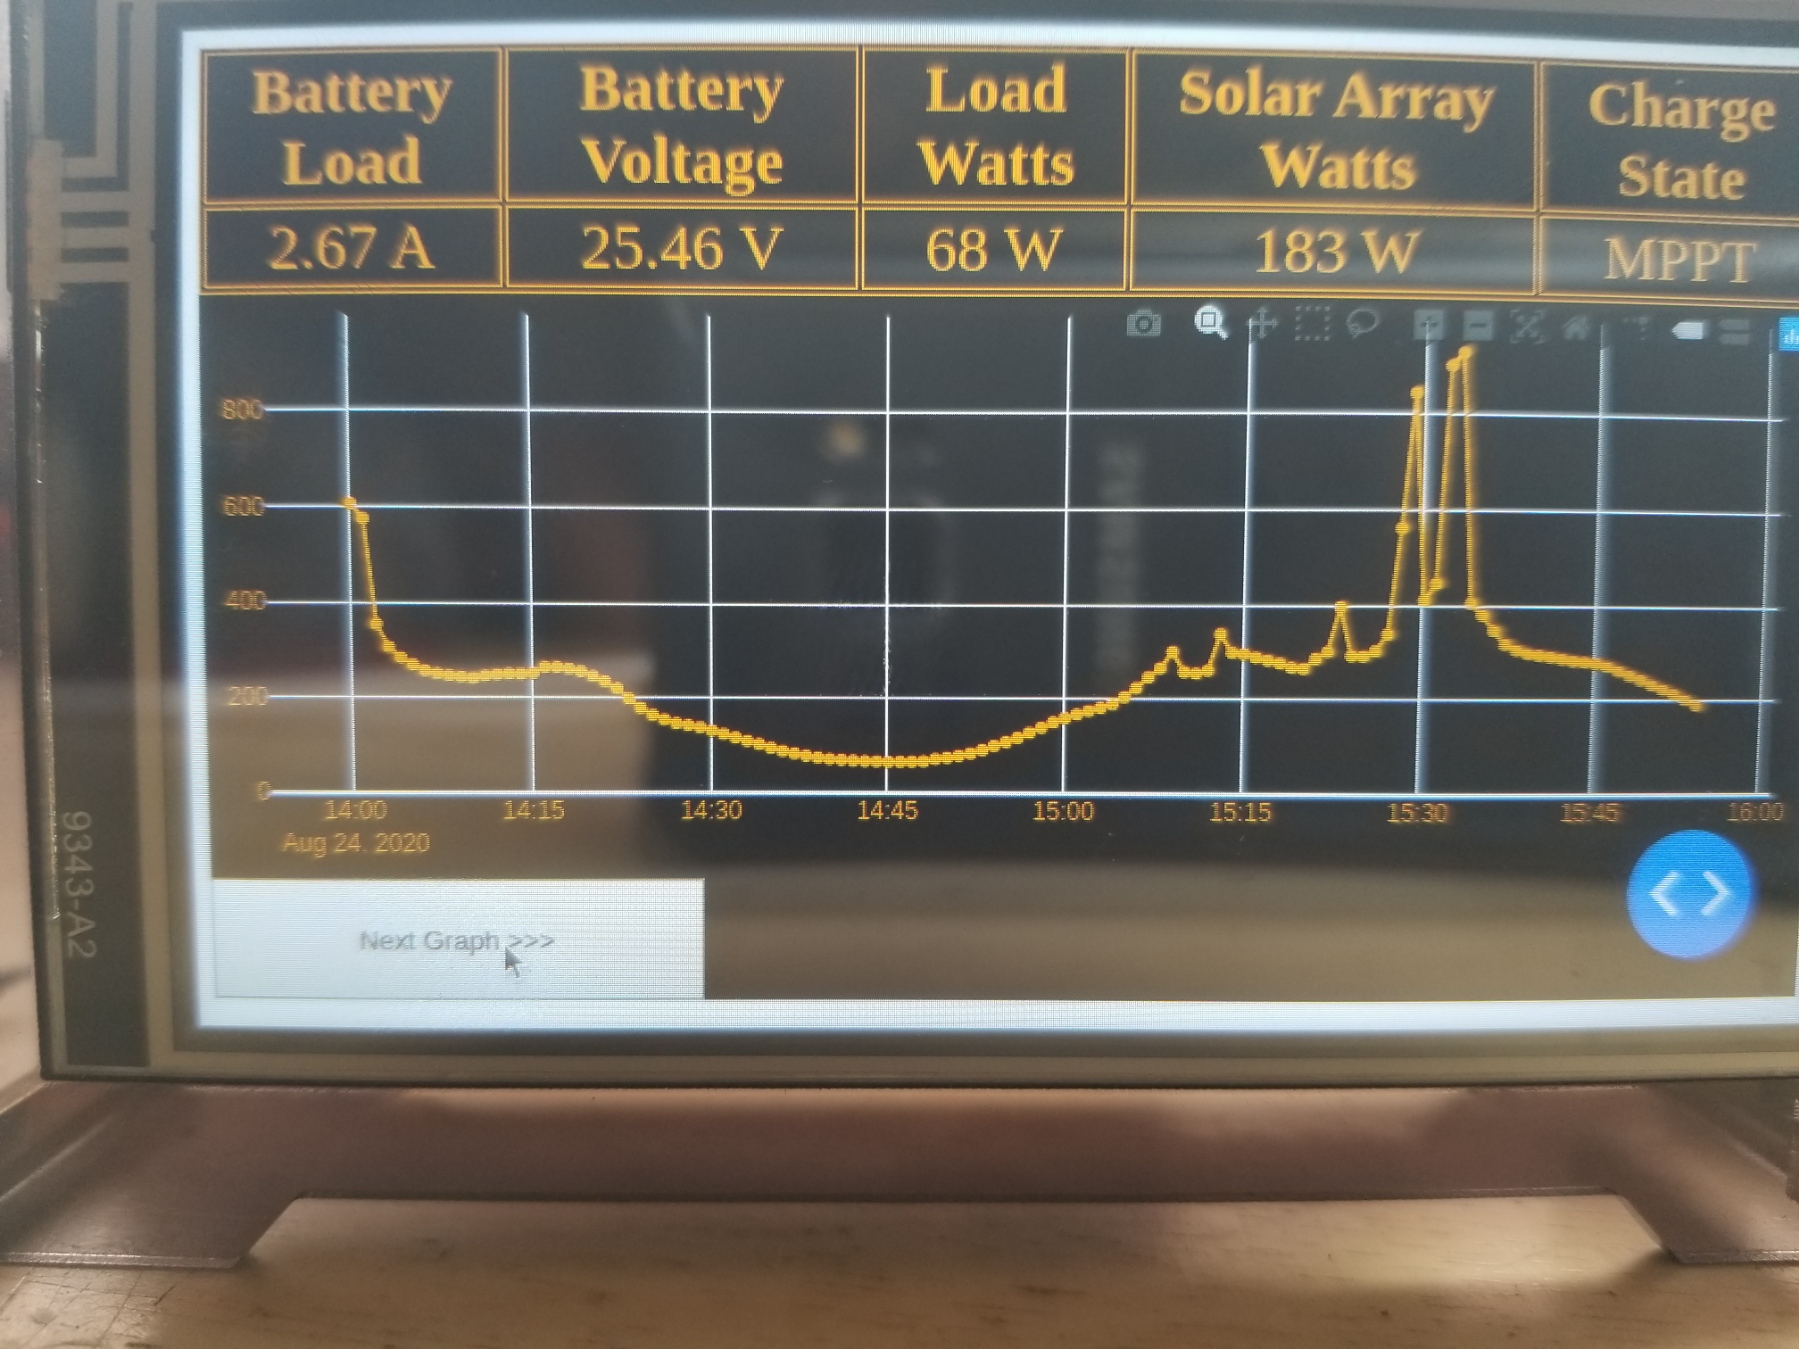
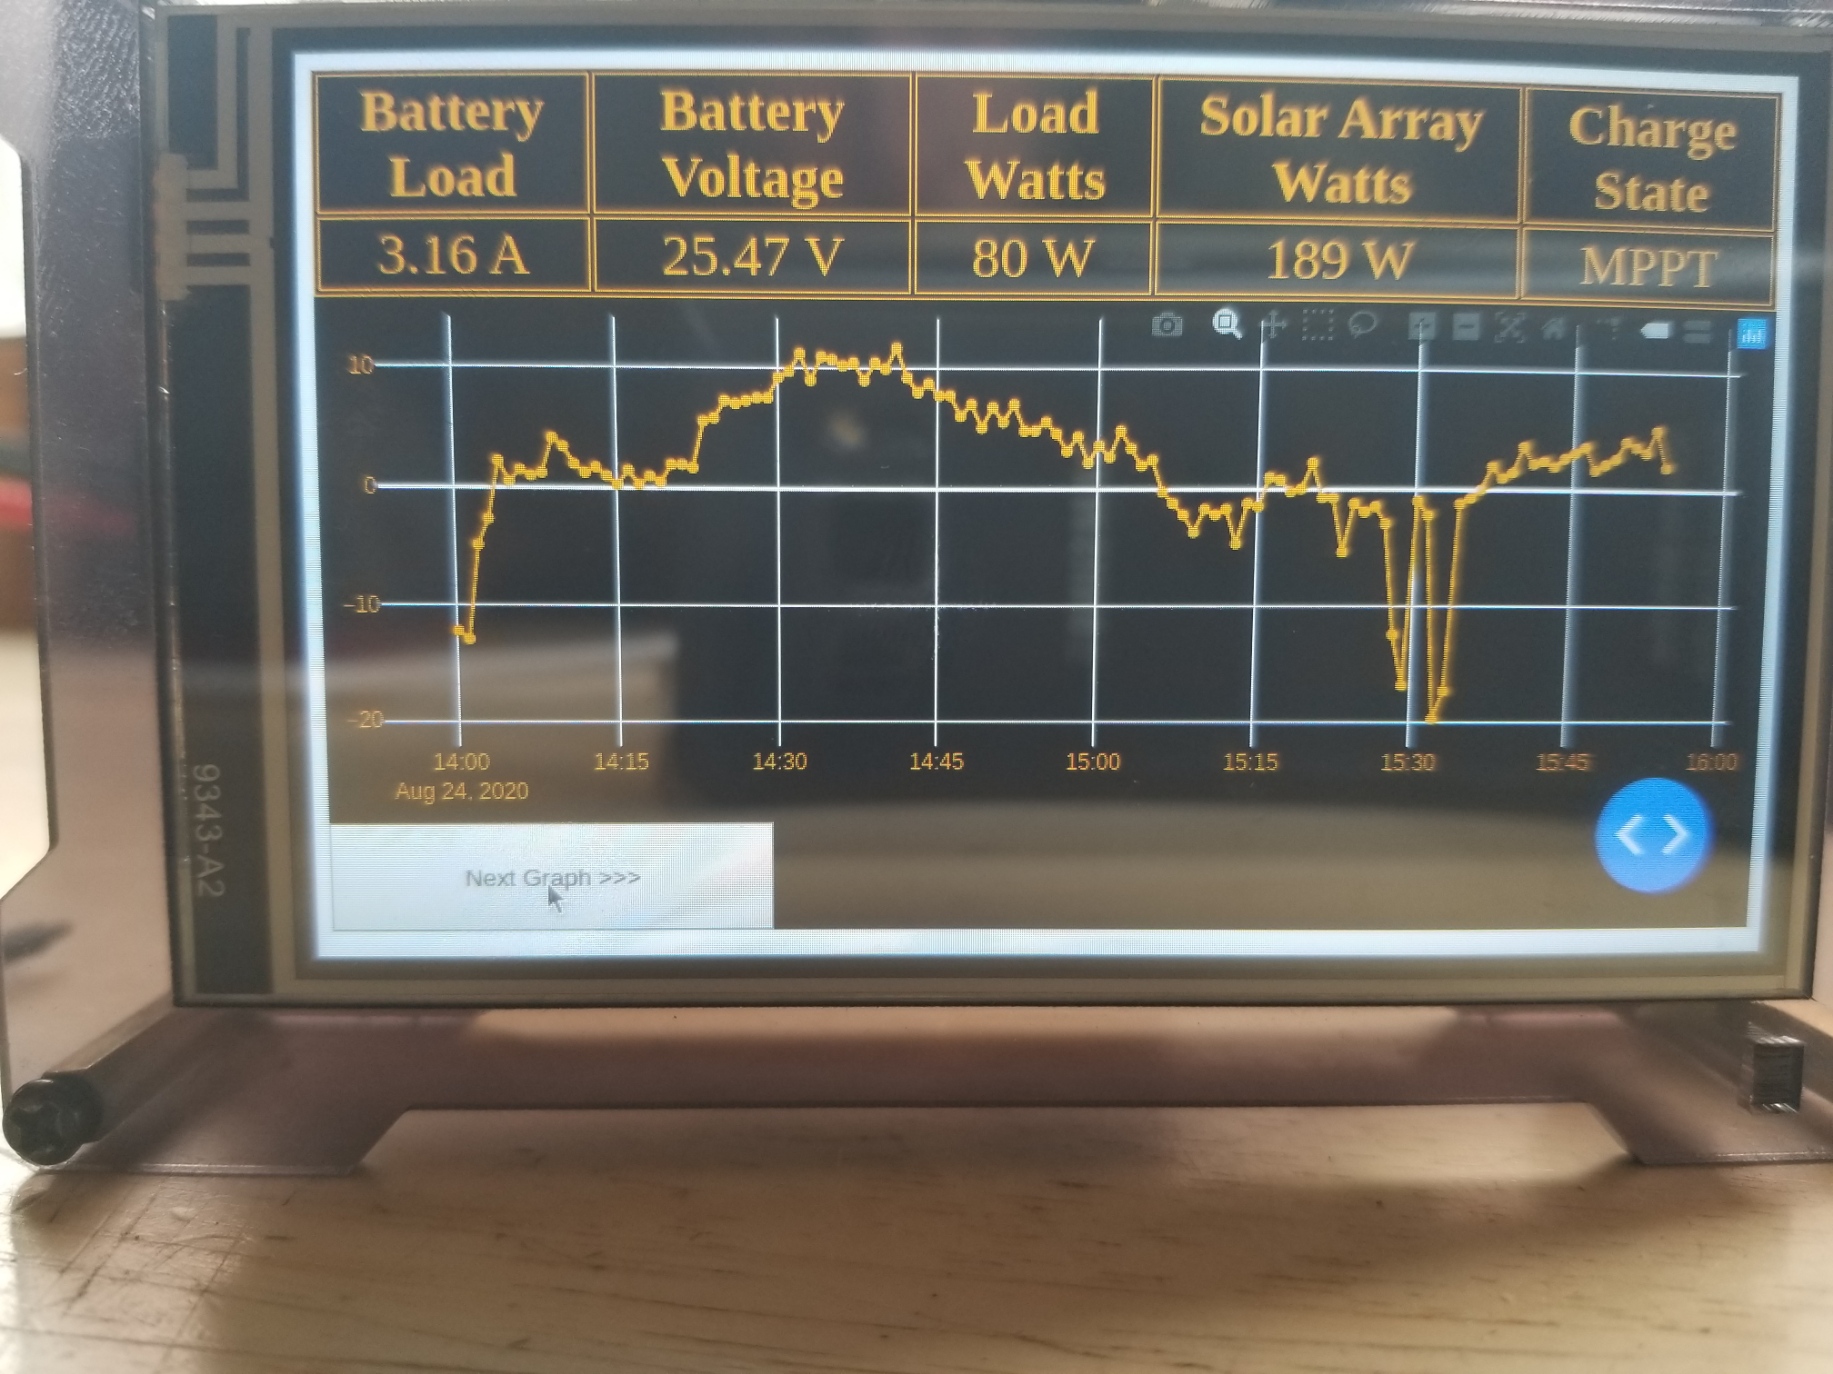
So now what I wanted is a single place I could go to view data from the new current sensor installed on the battery, and couple that with information from the charge controller so I could get a great view of everything going on with my system.
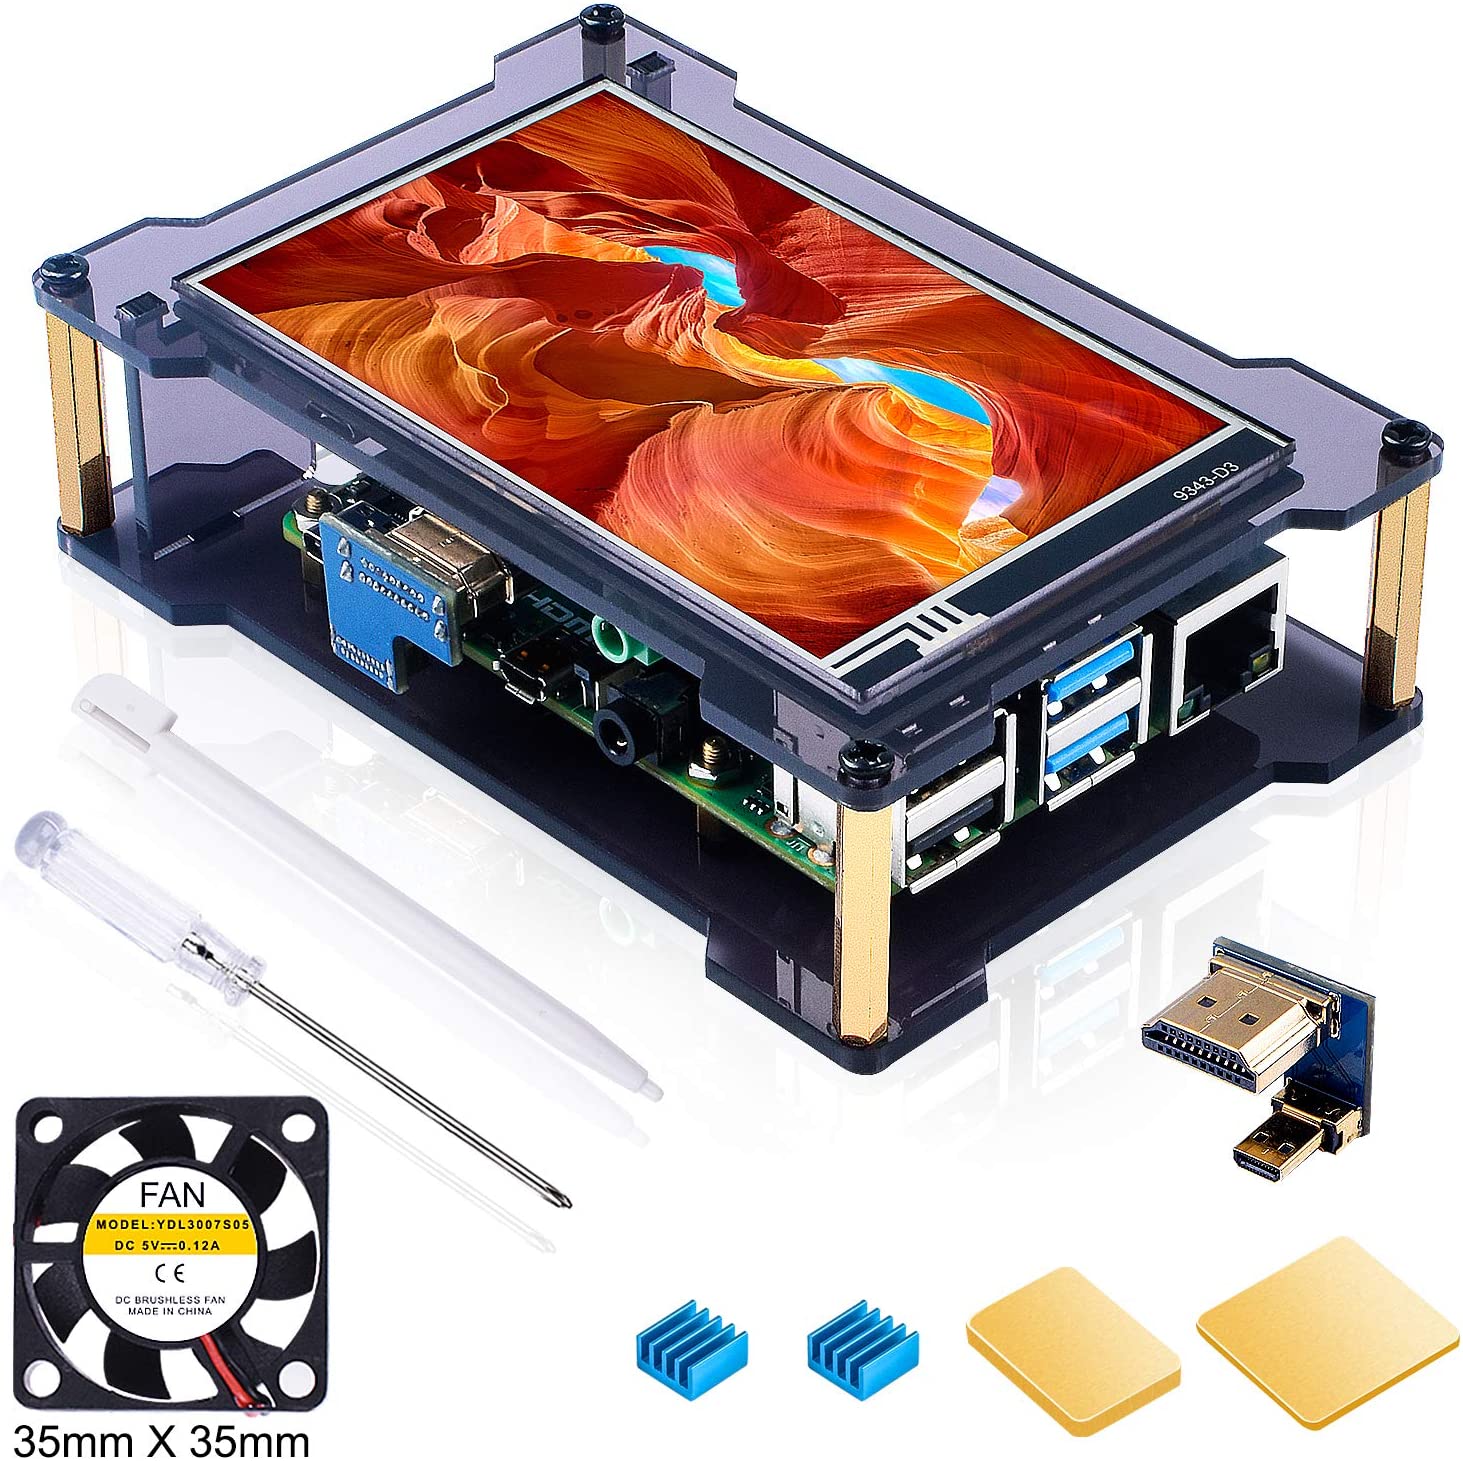
To that end, I decided on utilizing a Raspberry Pi 4 with a integrated touch screen solution. This handy unit came with simple case and a touch screen that plugs right into the pi and works as a standalone system I could create a web based application on to monitor all of the stats. I will mount this to the wall as a single view of all of the energy parameters and what is going on over time.
I decided on using Dash to create the simple application that would query both modbus and our new REST endpoint, as it is something that I can rapidly iterate on down the road without spending a ton of development time, which when working for a startup is very precious time indeed. I wanted this up and running fast and simply.
Since dash apps are browser based and server based, the Raspberry Pi with the desktop installed is a perfect fit, utilizing the default chromium browser. I have instructions in the readme file of the repository on how to auto start a full screen browser instance on reboot of the pi so it ends up filling the entire screen.
The Results are In
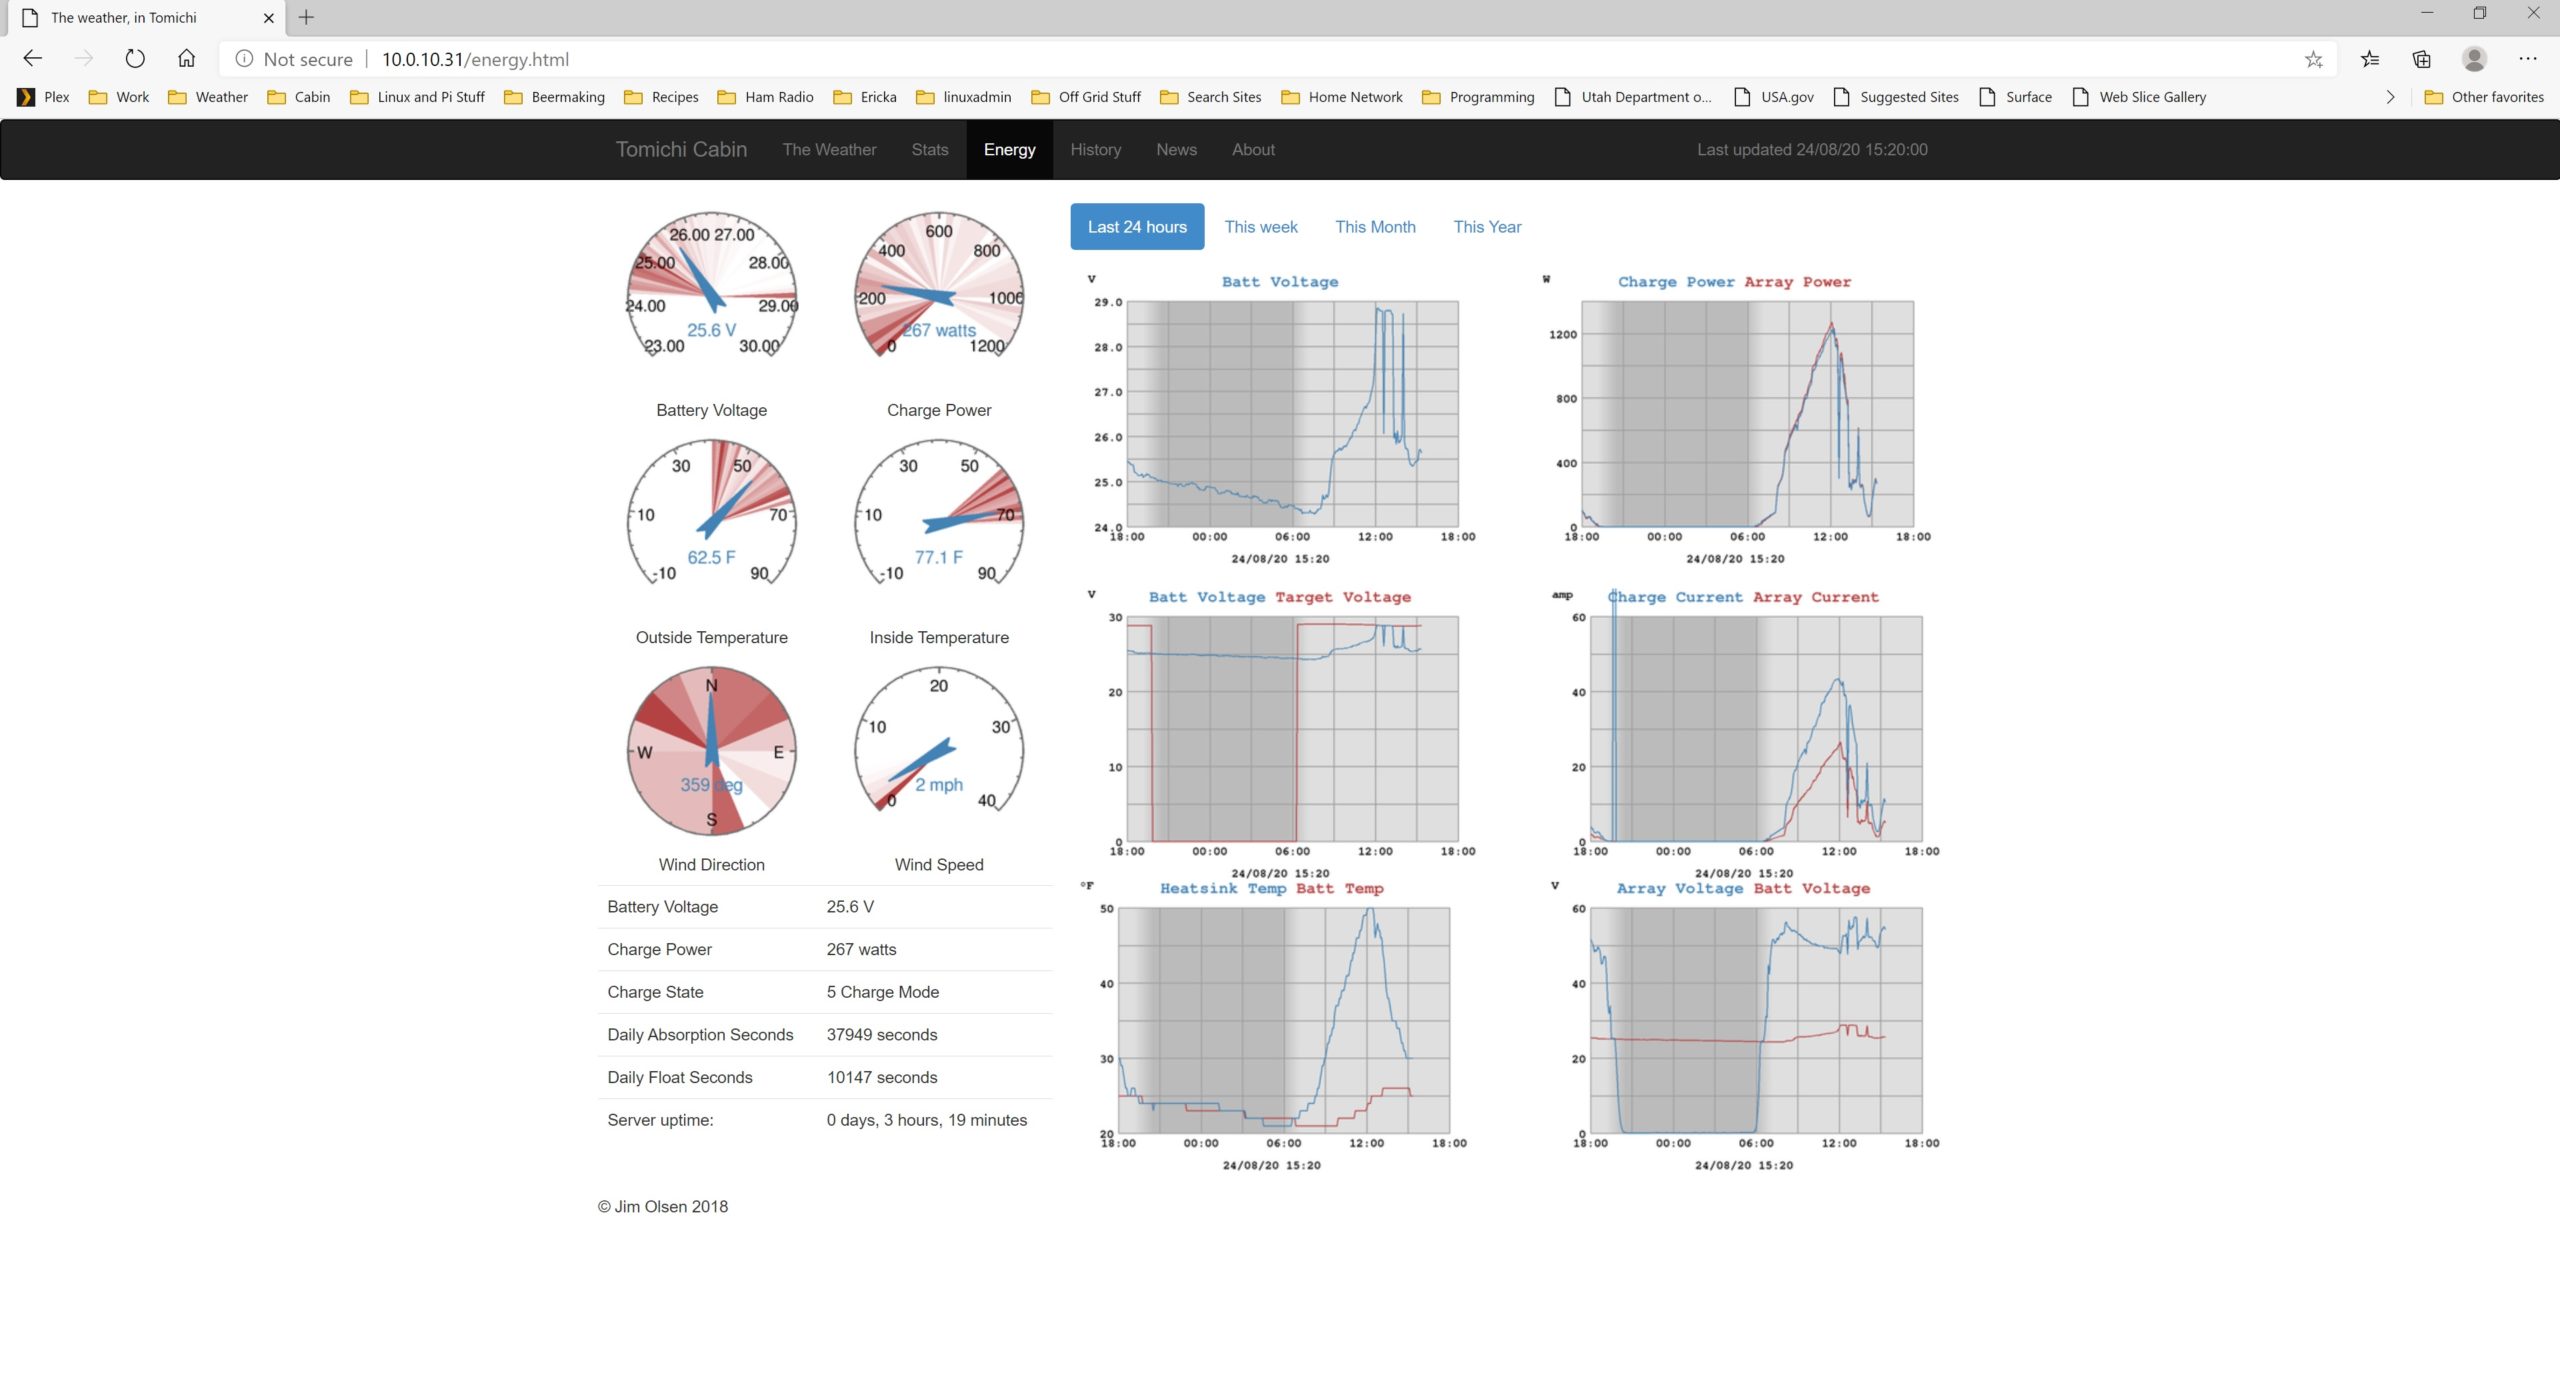
So designing the software was relatively easy. A dash app is fairly basic in that you initialize the application with a framework for the page. In this case, I put a simple table at the top to hold the raw values, a plotly graph just below that, and a button to rotate through the different graphs. I then utilized dash intervals to periodically update both the table text and the graphs. I suggest reviewing the code directly to see how it all works, as it is reasonably straightfoward.
Every five seconds, it would fetch the values from the REST endpoint on the Arduino, and would also use the modbus protocol to read the values from the charge controller. These are tied to the table values on the top of the screen and give me the rapid response information of real time stats.
Every minute, it does the same query, but adds to a graph data array that contains all of the values against time. These are stored for a maximum of 24 hours before they rotate out and are replaced by the newer values.
I have three graph options right now of battery load (can be positive or negative), solar array wattage, or battery voltage. By simply hitting the button at the bottom of the screen, I can switch between these graphs.
So overall now, I can see what is actually going into and out of the batteries, as well as what I am producing for power overall and track the battery status with all of this being viewable over time, and in a way it is flexible and quick for me to expand the solution.
My next expansion will likely include adding another sensor just on the load portion of the circuit itself so I can also monitor the actual load on the system ignoring any of the solar input. As I’ve designed it, all’s I have to do is hitch it up to the A1 port on the Arduino, and will not have to change any of the existing Arduino code. Then I need to simply add to the dash app and away we go! Always design your software with the flexibility up front so it is easy to expand in the future.
I may also persist some of the values out to keep a running tab on the energy usage, etc. I now have a fully platform to add any view I want on my energy system which can be rapidly developed using python. The sky is the limit!
Thanks for joining me on my project journey this week and hope you will join me in next week’s blog post!
Jim Olsen
Off Grid CTO